Welcome to our comprehensive guide on “How to track your finances.” In this tutorial, we will navigate the powerful tools and features of Groflex’s dashboard, enabling you to gain a clear and insightful view of your financial landscape.
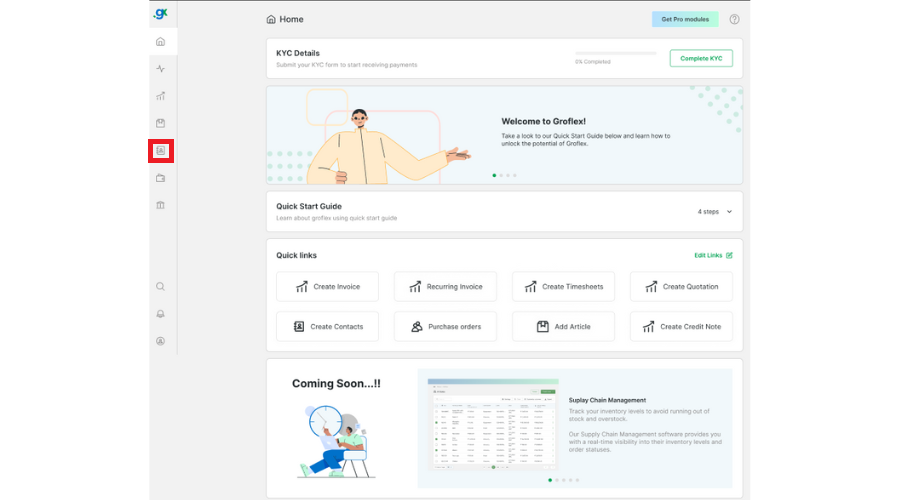
STEP 1:
From the homepage, click on the dashboard icon.
STEP 2:
From the top of the dashboard, you can view the total amount receivable from unpaid invoices and the amount overdue. Additionally, you can also see the total unpaid bill amount, with green representing the total and red indicating the amount overdue.
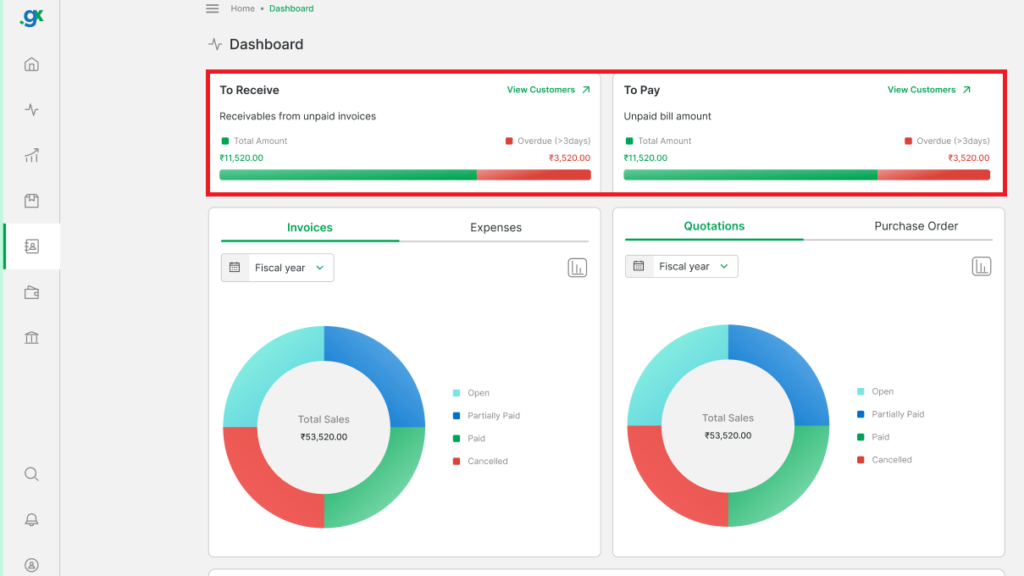
STEP 3:
You can check the total sales of invoices and quotations categorized by colour: cyan for ‘open,’ sapphire for ‘partially paid,’ green for ‘paid,’ and orange for ‘cancelled’.
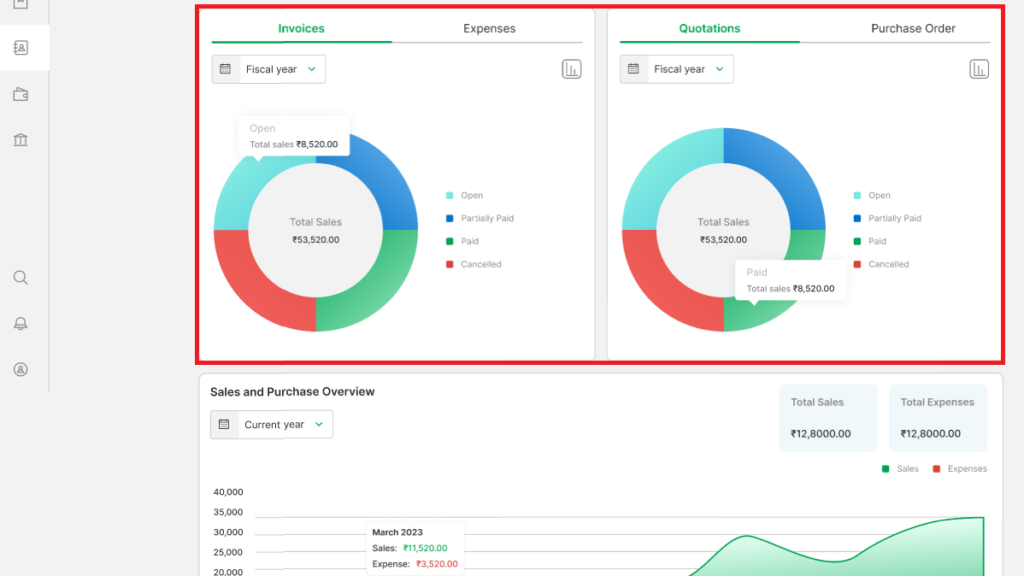
STEP 4:
You can see an overview of your sales and purchases under ‘Sales and Purchase Overview’.
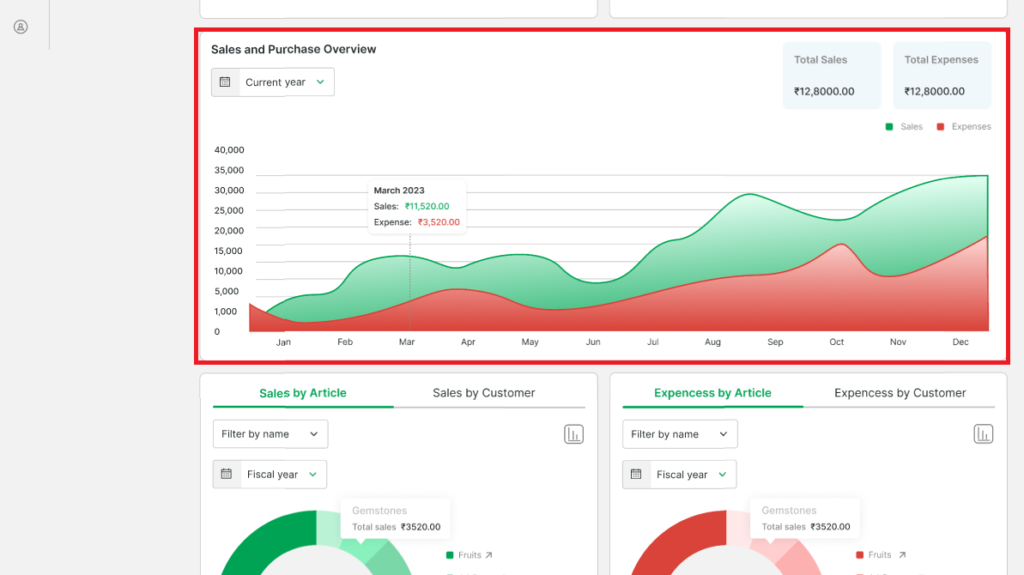
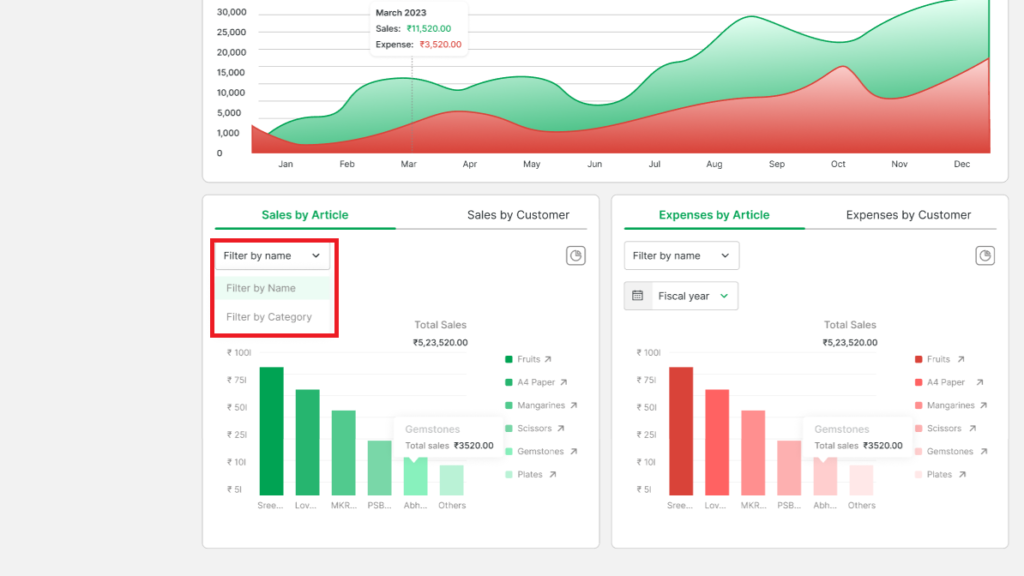
STEP 5:
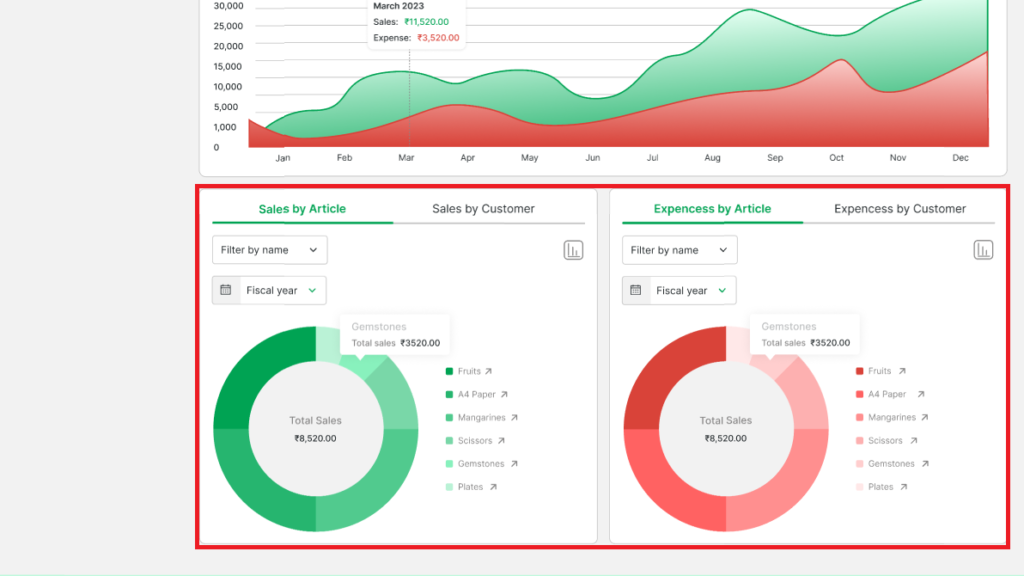
You can check Sales and Expenses by Article/Customer, where each article or customer is represented by various shades of green or red.
FINAL STEPS:
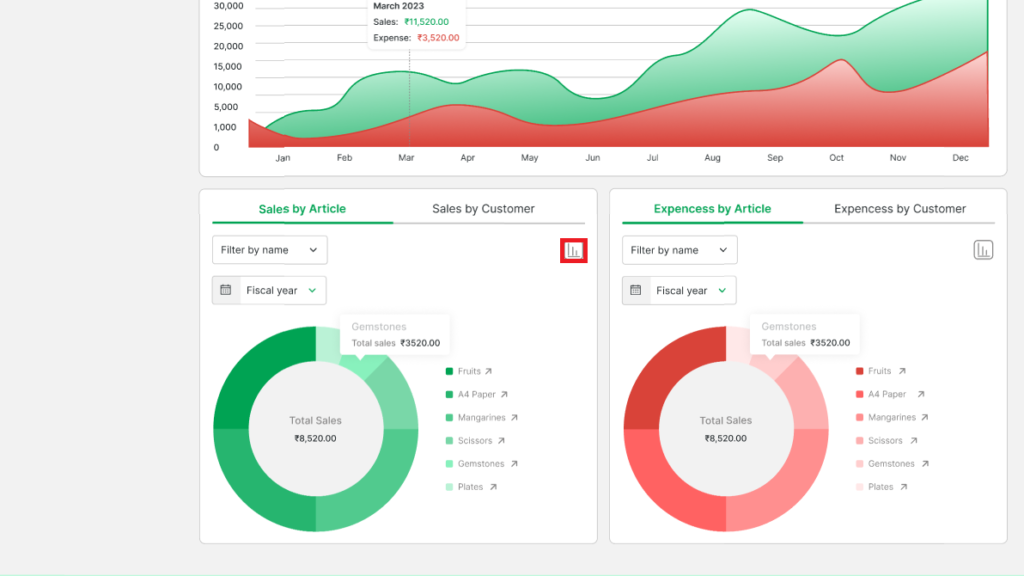
Switch between pie and bar chart by clicking the chart icon.
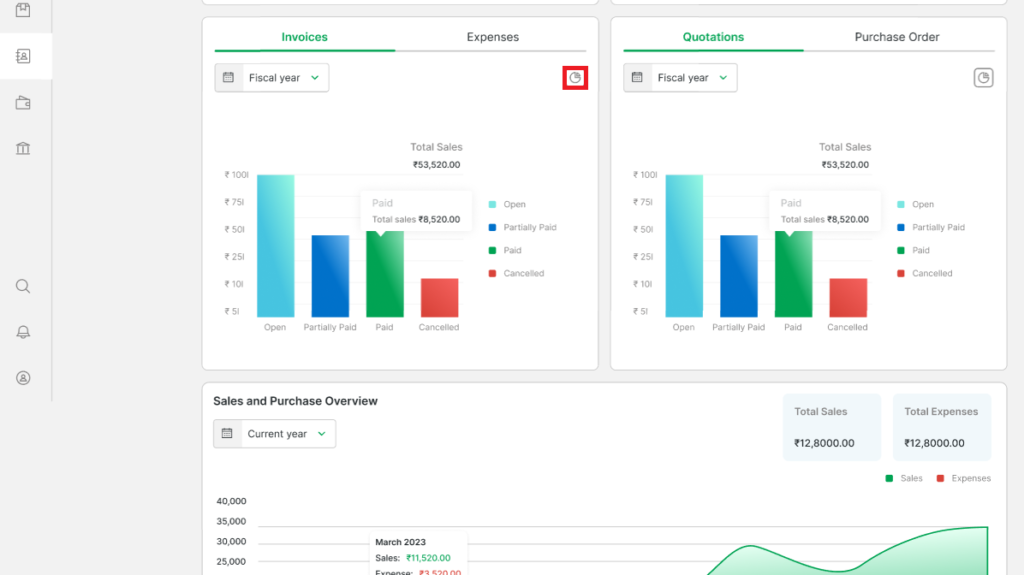
You can change the calculation date.
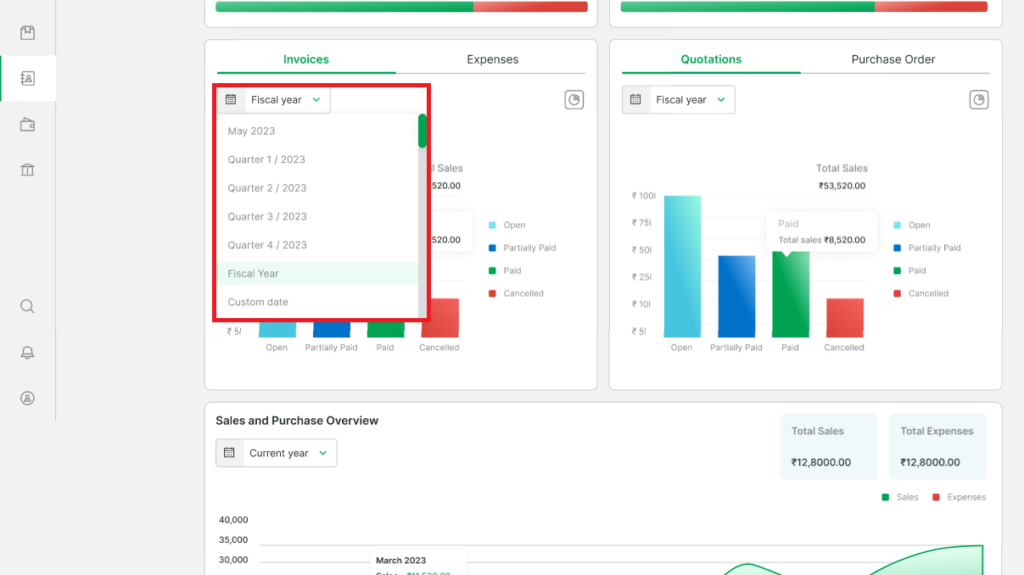
You can also filter by name or by category.
CONCLUSION
Congratulations! You’ve successfully learned how to use Groflex’s dashboard to track your finances using our step-by-step guide. Now, you can harness the full potential of this tool to make informed financial decisions and secure your financial future.
Here, you will find all the related tutorials.